
Last updated on 2025-01-07
3. What is SORA, SOR, FHR or Mortgage Board Rates?
4. 3 Month SIBOR Rate History Chart
5. 3 Month SIBOR Historical Rate
6. 1 Month SIBOR Rate History Chart
7. 1 Month SIBOR Historical Rate
SIBOR is the acronym for Singapore InterBank Offer Rate. In layman terms, it simply represents the interest rate that Singapore banks charge to lend to each other. SIBOR is regularly used as a reference rate where loans are pegged to. SIBOR was set daily (working days) by the Association of Banks in Singapore and was publicly available on Association of Banks in Singapore website. In general the shorter the time period SIBOR is based on, the lower and more volatile the interest rate. However, SIBOR has been discontinued at the end of 2024 and replaced by SORA.
3 Month SIBOR rate was around 3.30% as compared to 1 Month SIBOR rate which was around 3.28% before they were discontinued at the end of 2024.
SORA is the acronym for Singapore Overnight Rate Average and is the average interest rate of unsecured overnight interbank SGD transactions brokered in Singapore. SORA is similar to SIBOR but is based on recorded past transactions and hence is backward looking. SOR is the acronym for Swap Offer Rate and is basically the interest rate a borrower will be charged if he or she were to borrow in US dollars. SORA has replaced SOR in 2021 and will be replacing SIBOR by 2024. Fixed Deposit Linked rates are reference rates that are based on a bank's fixed deposit rates while Board Rates are rates determined internally by banks based on their own benchmark rates.
All of the mentioned rates are reference rates where loans are priced in but SORA is currently the most popular reference rate for loans to be priced in due to its transparency and relative stability. Hence, any movement in SIBOR rates is closely monitored as it could affect repayment of loans and also financial markets. It is also worth noting that all these reference rates usually move in tandem with each other in the same direction. See SIBOR vs Fixed Deposit Linked Rates vs Board Rate for a more detailed discussion about how to choose the best reference rate for loan packages.
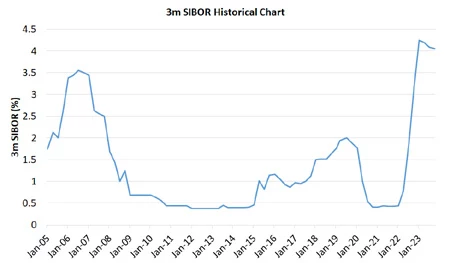
| Jan 24 | Feb 24 | Mar 24 | Apr 24 | May 24 | Jun 24 |
| 4.06% | 4.06% | 4.06% | 4.06% | 4.05% | 4.05% |
| Jul 24 | Aug 24 | Sep 24 | Oct 24 | Nov 24 | Dec 24 |
| 4.05% | 3.90% | 3.70% | 3.30% | 3.30% | 3.30% |
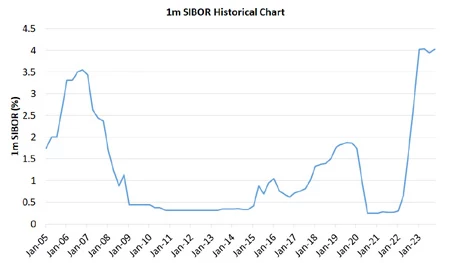
| Jan 24 | Feb 24 | Mar 24 | Apr 24 | May 24 | Jun 24 |
| 4.03% | 4.02% | 4.02% | 4.03% | 3.91% | 3.91% |
| Jul 24 | Aug 24 | Sep 24 | Oct 24 | Nov 24 | Dec 24 |
| 3.91% | 3.85% | 3.65% | 3.35% | 3.28% | 3.28% |
Interest rates have dipped ever since SORA was discontinued. Borrowers can start looking for SORA floating interest rate loans to take advantage of lower rates over the next 12 months as inflation dips and mortgage rates drop likewise.

With the widespread popularity of online shopping websites such as Lazada, Qoo10 or Shopee which promise lower prices...

What is the current average fixed deposit rates in Singapore?